Covered California Releases 2019 Individual Market Rates: Average Rate Change Will Be 8.7 Percent, With Federal Policies Raising Costs

- The weighted average rate change is 8.7 percent, but with robust competition, most consumers can avoid any increase if they switch to the lowest-cost plan in the same metal tier.
- Without the federal decision to eliminate the individual mandate penalty, which added between 2.5 and 6 percentage points to the rates, consumers would be seeing a rate change closer to 5 percent.
- California remains a strong and stable individual marketplace as it heads into its sixth year, with all 11 health insurers in Covered California returning for 2019 and 96 percent of consumers able to choose from two insurers or more.
SACRAMENTO, Calif. — Covered California on Thursday announced a modest rate change for 2019 and said many enrollees will be able to mitigate the impact if they shop and switch to the lowest-cost plan in the same metal tier. The exchange also described how the recent federal decision to eliminate the penalty for the individual mandate will raise costs for the federal government and all consumers in the individual and employer-sponsored markets.
“Covered California continues to benefit millions of people in our state by giving them access to high-quality, affordable health coverage,” said Covered California Executive Director Peter V. Lee. “It is unfortunate when a rate change of nearly 9 percent is generally viewed as good news, when the rate change could — and should — have been much lower.”
Consumers in both Covered California and off-exchange in the individual market will see an overall average statewide rate increase of 8.7 percent to their gross premiums if they renew coverage in the same plan for 2019 (see Table 1).
The proposed rates, negotiated with Covered California and filed Thursday with regulators and subject to their final review, mean those who receive a subsidy to help purchase coverage will pay an average of 6 percent more if they renew in the same plan next year, which translates to an estimated monthly premium of $123 after tax credits. Subsidized consumers account for 88 percent of Covered California’s enrollment, and those subsidies rise along with rates to help offset any increases.
Consumers, both on and off the exchange, will continue to benefit from Covered California’s competitive marketplace, which allows them to shop for the best value and save money if they switch plans. The average rate change for consumers who shop and switch to the lowest-cost plan in the same metal tier is -0.7 percent, which means that many Californians can pay the same rate as they do now in 2018, or a little less, if they shop and switch.
“Covered California’s marketplace fosters competition that puts consumers in the driver’s seat and gives them the power to shop and save,” Lee said. “Health care is local, and the price of coverage varies by health plan and region, so consumers will be encouraged to shop when they renew this fall.” (See Table 2 for a complete list of rate changes by region.)
All 11 insurers currently serving Covered California will return for the 2019 coverage year. Covered California’s competitive marketplace continues to promote choice, with 96 percent of consumers being able to choose from two insurers or more and 82 percent of consumers having three or more choices.
Table 1: Covered California’s Premiums
PLAN YEAR
|
5-Year Average
|
|||||
2015
|
2016
|
2017
|
2018
|
2019
|
||
Weighted Average Increase
|
4.2%
|
4.0%
|
13.2%
|
12.5%*
|
8.7%
|
8.4%
|
Lowest-Priced Bronze (unweighted)
|
4.4%
|
3.3%
|
3.9%
|
11.8%
|
10.2%
|
6.7%
|
Lowest-Priced Silver (unweighted)
|
4.8%
|
1.5%
|
8.1%
|
9.2%*
|
5.2%
|
5.7%
|
If a consumer switches to the lowest-priced plan in the same tier
|
—
|
-4.5%
|
-1.2%
|
3.3%
|
-0.7%
|
—
|
* The
2018 weighted average has been adjusted to remove the cost-sharing reduction
surcharge applied in 2018, since unsubsidized or off-exchange enrollees do not incur
the surcharge, and tax credits help defray the costs of rate increases for
those eligible for subsidies.
Lee said the elimination of the penalty for those who choose not to buy health insurance had a negative impact on rates for 2019. Carriers added between 2.5 and 6 percent to their rates, with an average of 3.5 percent, due to concerns that the removal of the penalty will lead to a less healthy and costlier consumer pool.
Covered California estimates the 3.5 percent increase added to the rates will mean Californians will be spending more than $400 million more on their health care coverage in 2019. While subsidized consumers will be protected from this increase, since the amount of financial help they receive will also increase, the federal government will end up paying an estimated $250 million more in higher tax credits. Unsubsidized consumers on- and off-exchange will bear the full brunt of the increase.
“The cost of the penalty removal will manifest for unsubsidized consumers in higher rates. While subsidized people will not bear the full costs, taxpayers will,” Lee said. “The additional losers from this policy change will be those who decide to roll the dice, go without coverage, and end up with hundreds of thousands of dollars in medical bills.”
Lee said some federal changes will affect more than just rates in 2019. The elimination of the penalty for going without health insurance will likely affect enrollment.
Covered California estimates that the elimination of the individual mandate penalty could reduce enrollment in California’s individual market by 262,000 consumers in 2019. Analysis conducted by PricewaterhouseCoopers found that the removal of the individual mandate penalty could also result in uncompensated care rising by $1,000 per newly uninsured person. If all uncompensated care costs — that are not covered elsewhere — were shifted to private insurance, the cost of employer-sponsored coverage could increase by between 2 and 4 percent, a cost that would most likely be shared between the employer and the employee.
Other factors influencing the rates include “medical trend” — or the general change in the cost and usage of medical services and products — which accounts for 7.5 percent of the rate change. In addition, the federal suspension of the health insurer tax for 2019 kept rates about 1.6 percent lower than they might have been.
“While there is a one-year reduction in rates due to the suspension of the insurer tax, the impact of removing the penalty for the individual mandate is permanent and is far larger,” Lee said.
Covered California Remains Strong and Stable
Covered California remains a strong and stable marketplace that has served more than 3.5 million Californians since it first began offering coverage in 2014. During that time, more than 5 million Californians have enrolled in the expanded Medi-Cal program. Together, these achievements have helped California reduce its uninsured rate from 17 percent at the end of 2013 to a record low of 6.8 percent at the end of 2017.
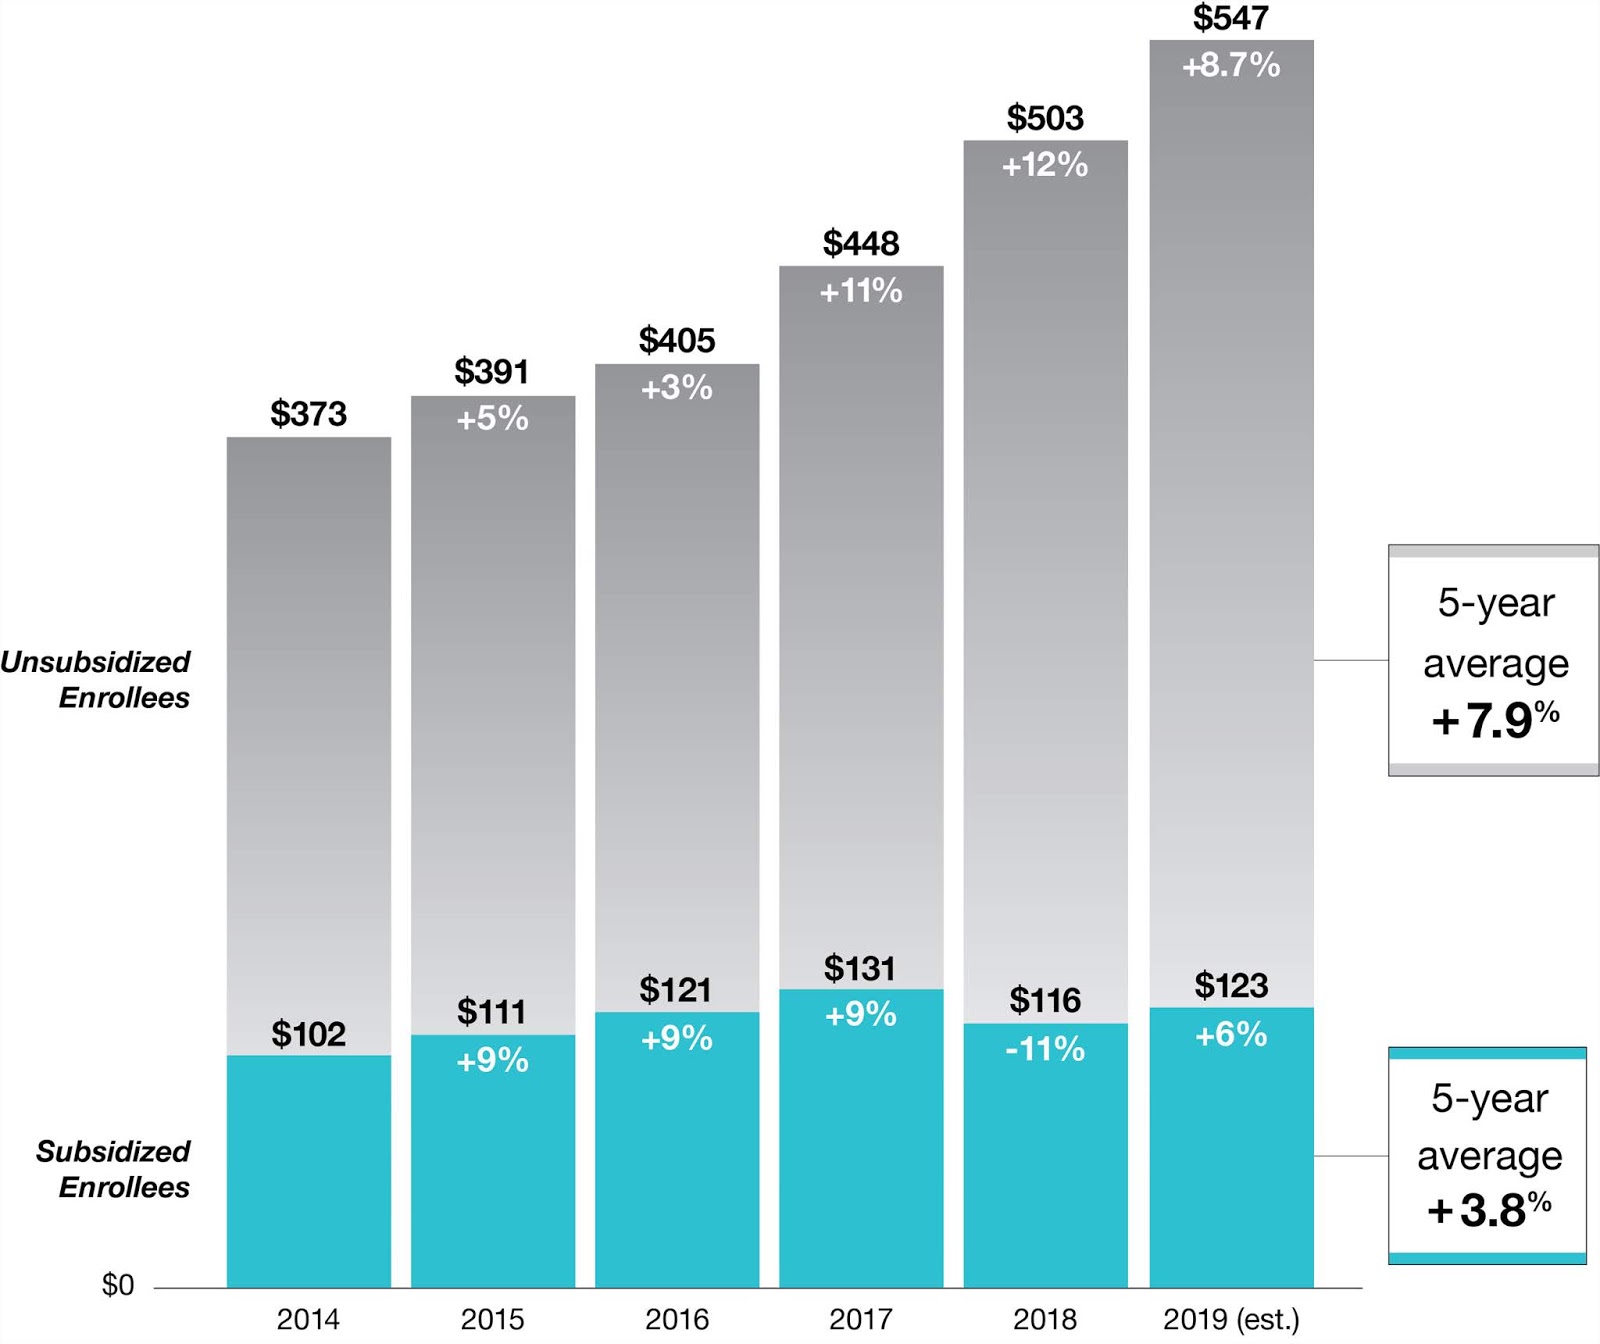
The historic gains made through steady enrollment have helped keep Covered California’s premiums at a stable level. Over the past five years, Covered California has held actual average annual rate changes for unsubsidized consumers to an estimated average of 7.9 percent and 3.8 percent for subsidized consumers (see Figure 1: California’s Individual Market Premiums).
Figure 1: California’s Individual Market Premiums [1]
The stability in Covered California’s premiums has fostered steady enrollment in California’s individual market. While the total enrollment in the nation’s individual market peaked at approximately 12.4 million in 2016, it declined by 10 percent in 2017, or roughly 1.5 million consumers. The decrease is driven primarily by a 20 percent reduction, which accounts for 1.3 million people, in the number of unsubsidized consumers in the individual market. In stark contrast, the number of unsubsidized consumers in California’s individual market has remained constant.
“In California we have 1 million unsubsidized consumers in the individual market, and while they will be protected from significant rate changes because of the positive effect of marketing and a competitive environment, we are worried that the rest of the nation is seeing millions of people at risk of being priced out of coverage,” Lee said.
Covered California’s steady enrollment further helps keep rates stable because its consumers are healthier than average, as measured by risk scores. A recent analysis published in the Health Affairs Blog, “National vs. California Comparison: Detailed Data Help Explain the Risk Differences Which Drive Covered California’s Success,” found that Covered California’s risk scores were lower than the national average from 2015 to 2017.
“Covered California’s strong enrollment, low premiums and healthy consumers are the result of promoting competition that focuses on lowering costs,” Lee said. “We will continue to put consumers first by providing them with high-quality coverage that ensures they can get the right care at the right time.”
Consumers can find out what they will pay for their 2019 coverage starting during the renewal period in October, when they can visit Covered California’s website at www.CoveredCA.com and begin using the Shop and Compare Tool for 2019.
Consumers who do not have health insurance will be able to begin signing up for 2019 coverage on Oct. 15. Others with special qualifying life events, like losing their coverage or moving, can enroll year round. Medi-Cal enrollment is also year round.
Interested consumers should go to www.CoveredCA.com to find out if they qualify for financial help and find free local help to enroll. They can contact the Covered California service center for enrollment assistance by calling (800) 300-1506.
Table 2: Covered California Rate Changes by Region
Pricing Region
|
Total enrollment*
|
Avg. rate change
|
Shop and save
|
Region 1
Alpine, Amador,
Butte, Calaveras, Colusa, Del Norte, Glenn, Humboldt, Lake, Lassen,
Mendocino, Modoc, Nevada, Plumas, Shasta, Sierra, Siskiyou, Sutter, Tehama,
Trinity, Tuolumne and Yuba counties
|
53,772
|
9.0%
|
5.3%
|
Region 2
Marin, Napa,
Solano and Sonoma counties
|
51,193
|
9.1%
|
3.1%
|
Region 3
Sacramento,
Placer, El Dorado and Yolo counties
|
79,158
|
8.8%
|
3.5%
|
Region 4
San Francisco
County
|
36,099
|
9.4%
|
1.5%
|
Region 5
Contra Costa
County
|
44,114
|
8.4%
|
1.7%
|
Region 6
Alameda County
|
63,554
|
9.4%
|
4.4%
|
Region 7
Santa Clara
County
|
58,435
|
6.3%
|
-12.2%
|
Region 8
San Mateo County
|
24,283
|
9.3%
|
2.7%
|
Region 9
Monterey, San
Benito and Santa Cruz counties
|
27,283
|
16.0%
|
11.4%
|
Region 10
San Joaquin,
Stanislaus, Merced, Mariposa and Tulare counties
|
68,817
|
6.8%
|
0.5%
|
Region 11
Fresno, Kings
and Madera counties
|
32,674
|
3.2%
|
0.4%
|
Region 12
San Luis Obispo,
Santa Barbara and Ventura counties
|
65,829
|
8.7%
|
1.4%
|
Region 13
Mono, Inyo and
Imperial counties
|
13,329
|
-0.5%
|
-3.5%
|
Region 14
Kern County
|
17,715
|
8.3%
|
6.9%
|
Region 15
Los Angeles
County (northeast)
|
173,381
|
10.0%
|
-1.1%
|
Region 16
Los Angeles
County (southwest)
|
213,126
|
8.6%
|
-5.2%
|
Region 17
San Bernardino
and Riverside counties
|
123,025
|
9.0%
|
0.7%
|
Region 18
Orange County
|
133,166
|
9.0%
|
-2.2%
|
Region 19
San Diego County
|
116,149
|
9.0%
|
-3.8%
|
TOTAL
|
1,395,102
|
8.7%
|
-0.7%
|
About Covered California
Covered California is the state’s health insurance marketplace, where Californians can find affordable, high-quality insurance from top insurance companies. Covered California is the only place where individuals who qualify can get financial assistance on a sliding scale to reduce premium costs. Consumers can then compare health insurance plans and choose the plan that works best for their health needs and budget. Depending on their income, some consumers may qualify for the low-cost or no-cost Medi-Cal program.
Covered California is an independent part of the state government whose job is to make the health insurance marketplace work for California’s consumers. It is overseen by a five-member board appointed by the governor and the Legislature. For more information about Covered California, please visit www.CoveredCA.com.
[1] Premiums shown are the actual observed average premiums in Covered California administrative data for renewal and open-enrollment plan selections for plan years 2014 through 2018, and the percentage change is the change to the average observed premiums. Year over year, the average premiums shown may be influenced by changes in the population distributions (such as for region, age, metal tier, etc.). Average premiums for the off-exchange market as a whole could differ from the Covered California unsubsidized premiums to the extent that the off-exchange population and plan-choice profiles differ from the on-exchange, unsubsidized profile. Additionally, the 2018 unsubsidized premiums have been adjusted to remove the cost-sharing reduction “surcharge” in Silver, since off-exchange enrollees do not incur the surcharge, and Covered California encouraged its unsubsidized Silver enrollees to move off-exchange to avoid the surcharge in 2018. For coverage year 2019 premiums, this chart shows an estimate of what premiums would be if all consumers enrolled in their same 2018 plan for 2019. The chart applies the global weighted Covered California average increase of 8.7 percent to produce the estimated average unsubsidized premium, which is an estimate of what off-exchange enrollees may pay in 2019 (the actual 2019 amount will depend on enrollee take-up and plan choice during renewal and open enrollment).